 Wardenspire
BIDs
Business improvement districts
Show levy payers what your rangers and security teams deal with every day, and bring evidence to partner meetings instead of anecdotes.
For the people who look after public spaces
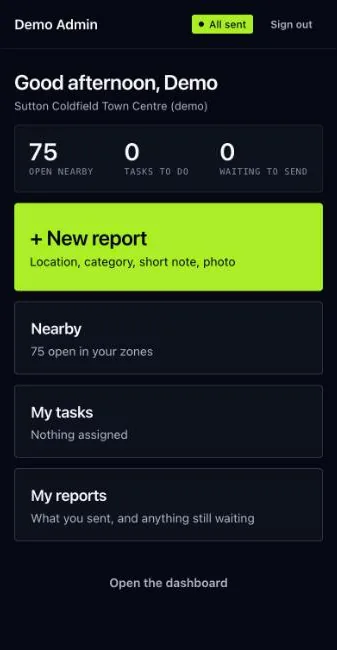
Wardens, rangers, security and patrol teams report what they see from their phones, even without a signal. Everyone responsible for the place sees one live picture, and the places and times that keep coming back.

Who it is for
BIDs
Show levy payers what your rangers and security teams deal with every day, and bring evidence to partner meetings instead of anecdotes.
Councils
See where litter, fly-tipping, damage and welfare concerns build up, and which jobs are still waiting.
Partners
Join the same picture as the street teams. Each partner sees the zones it works in, and every report keeps its history.
How it works
Four steps, one system. Nothing is typed up twice.
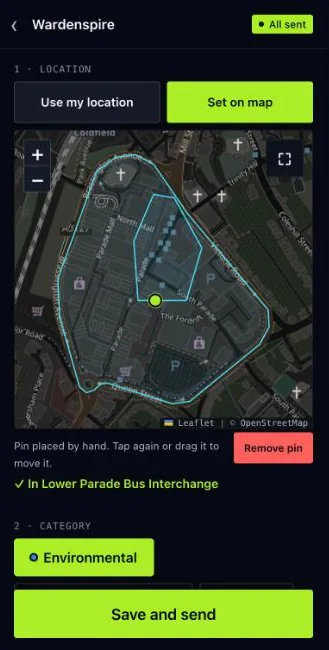
Location, category, a short note and a photo. Without a signal, the report waits on the phone and sends itself later.
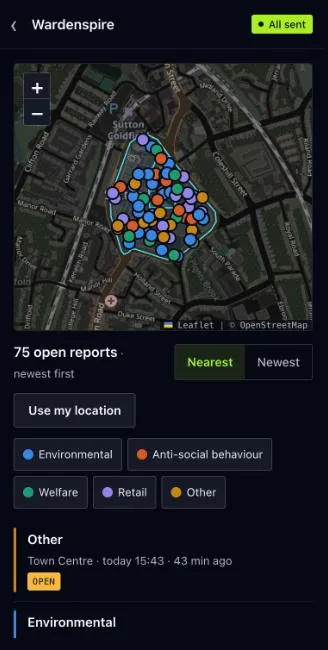
The report appears on the dashboard map and feed straight away, in the right zone, for everyone who covers it.
Turn a report into a task, assign it, and move it from open to monitored, referred or closed.
Insights show the busiest days and hours and the spots that keep coming up, ready to export for the board.
The product
These screens are from a demo account for Sutton Coldfield town centre, filled with made-up reports.
Dashboard
Open reports, new arrivals, what needs attention and tasks in progress, above a live map of your zones.

Field app
Install it from the browser onto the home screen. Use your location or set the pin on the map; the app checks it falls inside your zones.
Insights
Plain findings about places, times and categories, worked out from the reports themselves. Each finding links to the reports behind it.

Incidents
Search what was seen, filter by zone, status, category or reporter, and export exactly what you are looking at.

Built for trust
Reports can end up in front of a board, a licensing panel or a court. Wardenspire is built so the record holds up.
Places, not people
Insights are about places, times and categories. Nothing ranks staff or partners against each other.
Audit trail
Who did what and when, written in plain English. Nobody can edit or delete the log.
Evidence
Photos are stored as they were taken and stay attached to the report they belong to.
Separation
Every organisation has its own account. Field staff see and report only in the zones they cover.
Sign-in
Strong password storage, lock-out after repeated failed attempts, and sessions that end when access is removed.
Offline
Reports made without a signal are kept on the phone and sent as soon as it reconnects.
Book a demo
We set up a demo account drawn around your own area, with your zones and categories, so your team can try it on real streets before anything goes live.
What a demo covers